Article

So your impact report is negative, now what?

Learn how to diagnose negative results, uncover what changed, and take the right strategic actions to improve personalization impact.

Published: April 23, 2026

Hannah Solmor profile photo

Hannah Solmor

Senior Customer Success Manager,

Mastercard

Woman analyzing data on her tablet

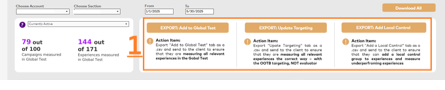
This guide is meant to be a companion document to the impact report in tableau. Following the “Action Item” prompts (seen below) as designated within the report will help you think big picture about what is happening. The details below are meant to be a deeper guide for asking the critical questions.

template

High level strategy diagnostic:

1. Expanding reach and measurement of your measured personalization program

template

2. Understanding saturation

  • What share of total experiences and campaigns are tagged into the impact report? Is the report a representative sample of the personalization program or a fractional snapshot?
  • Is there a large gap between the percentages covered experiences vs. campaigns? Are only a few experiences per campaign being included rather than all of them? What’s the explanation for this?

3. Looking at high level KPIs

  • Open the high level impact report and set to the relevant time frame
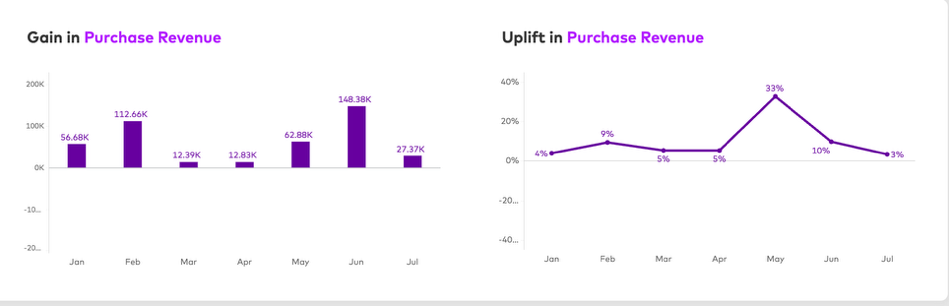
  • Analyze month over month performance for big dips or gains
template
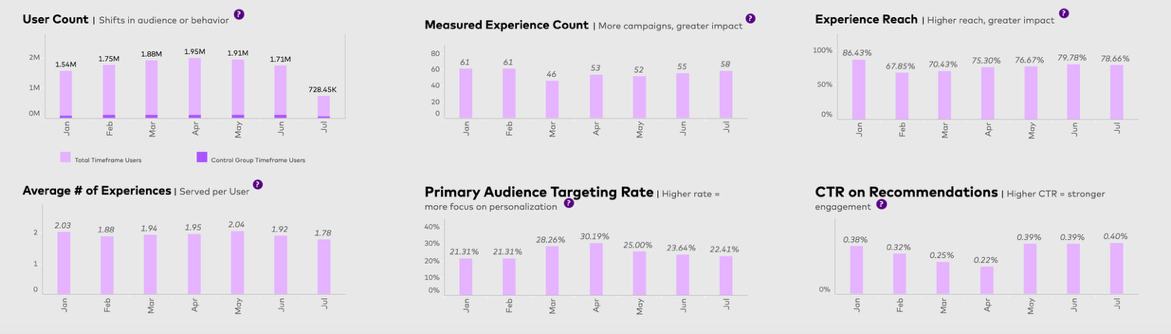
  • Compare that same time period to the explainer metrics in the section below – can you identify something that changed over that time period?
template
  • Can you identify one of these strategic initiatives to lean into because of it? Consider the following questions once you identify the area for concern:
    • User count:
      • Has the paid acquisition strategy to gain more traffic changed?
      • Were there any major shifts in referral sources or organic traffic?
      • Did a product update or external event reduce user interest or accessibility?
        • It may also benefit you to leverage the audience report dashboard to compare audience sizing shifts as well the segmented funnel dashboard to compare new vs. returning. Ex: Does your program favor a specific audience whose size is shrinking over time?
    • Measured Experience Count:
      • Have fewer experiences been tagged or included in the report recently?
      • Were any campaigns paused or removed from measurement?
      • Is there a discrepancy between live experiences and those being measured?
      • Are there technical issues preventing experiences from being tracked?
    • Experience Reach:
      • Are experiences being shown to a smaller subset of users than expected?
      • Has targeting become more narrow or exclusive?
      • Is the targeting logic excluding too many users?
    • Average # of Experiences:
      • Are users viewing fewer experience per user while reach is remaining stable? What’s a potential explanation for this: bounce, fatigue, irrelevant experiences?
      • Did a change in personalization logic reduce experience frequency?
      • Are certain experiences being prioritized over others?
    • Primary Audience Targeting Rate:
      • Has the targeting logic been updated recently? Could it have unintentionally excluded key audience segments?
    • CTR on Recommendations:
      • Has the design or placement of recommendations changed?
      • Are recommendations less relevant or engaging than before?
      • Did the recommendation algorithm or logic change recently?
      • Are users seeing too many repetitive or low-value recommendations?

If you’ve identified one of these above explainer metrics as a potential source of concern, consider exploring the 10 principles document for a high level strategy play.


Mapping ten principles to explainer metrics

Principle

Mapped explainer metric(s)

Why it mas

1. Prioritize quality and impactful ideas

– Incremental KPI
– Weight Average Uplift (these are at the campaign level below)

High-quality ideas should show strong uplift; weak ideas may show flat or negative KPIs.

2. Maximize Meaningful Reach

– Experience Reach
– Measured Experience Count
Reach determines how many users are exposed to personalization; low reach limits impact.

3. Adopt a Strategic Full-Funnel Approach

– Average # of Experiences
– CTR on Recommendations
A full-funnel strategy should increase engagement across touchpoints.

4. Use High-Visibility Placements and Balanced Formats

– CTR on Recommendations
– Experience Reach
Visibility and format influence clickthrough and exposure.

5. Reduce Bounce Rate on Key Entry Pages

– User Count
– Experience Reach
– Average # of Experiences
High bounce reduces funnel entry and reach; fewer users stay to engage.

6. Review Campaigns Weekly and Take Action

– Measured Experience Count
– Weight Average Uplift
Regular review helps identify underperformers and maintain saturation.

7. Personalize for Distinct Audience Segments

– Primary Audience Targeting Rate
– CTR on Recommendations
Targeting and personalization drive relevance and engagement.

8. Only Tag Campaigns That Show Positive Uplift

– Weight Average Uplift
– Incremental KPI (these are at the campaign level below)
Ensures the report reflects true value, not noise from neutral/negative tests.

9. Focus on Long-Term, Personalized Campaigns

– Measured Experience Count
– Experience Reach
Long-term campaigns accumulate impact and provide stable metrics.

10. ImpactOS is about quality, not quantity

– All metrics (especially Uplift, KPI, Reach)


Focus on meaningful data, not volume of tests or generic changes. 


Diagnosing issues at the campaign level

Getting set up:

  • Leveraging the campaigns + experiences tagged module in the top left, toggle between all active in time frame and currently live. Ask yourself:
    • Have many campaigns been turned off or excluded since the timeframe? How representative of your personalization program is this test based on its saturation?

Analyzing individual campaigns

  • Before diving into campaign analysis, decide which metric you want to use to evaluate performance
    By default, the OS Impact primary Metric is selected, and its name can be found at the top of the filter
template

Investigating negative-performing campaigns

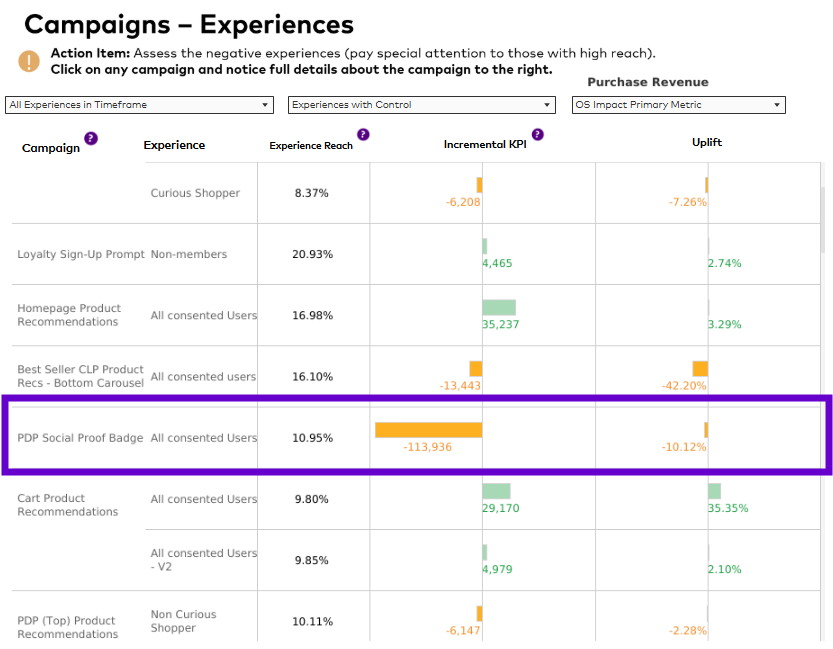
  • Start your investigation with the experiences showing the most negative incremental KPI. These are the experiences that likely had the biggest negative impact on OS Impact performance during the selected timeframe

    Example:
template
Note: Ask yourself: Is the reach large or small? This gives you a sense of how many users are being affected by the experience.

Once you’ve identified campaigns or experiences to investigate, ask:

  1. What happened to these campaigns over time?
  2. What can be done to improve its performance?

Use these three steps for each campaign to guide your analysis:

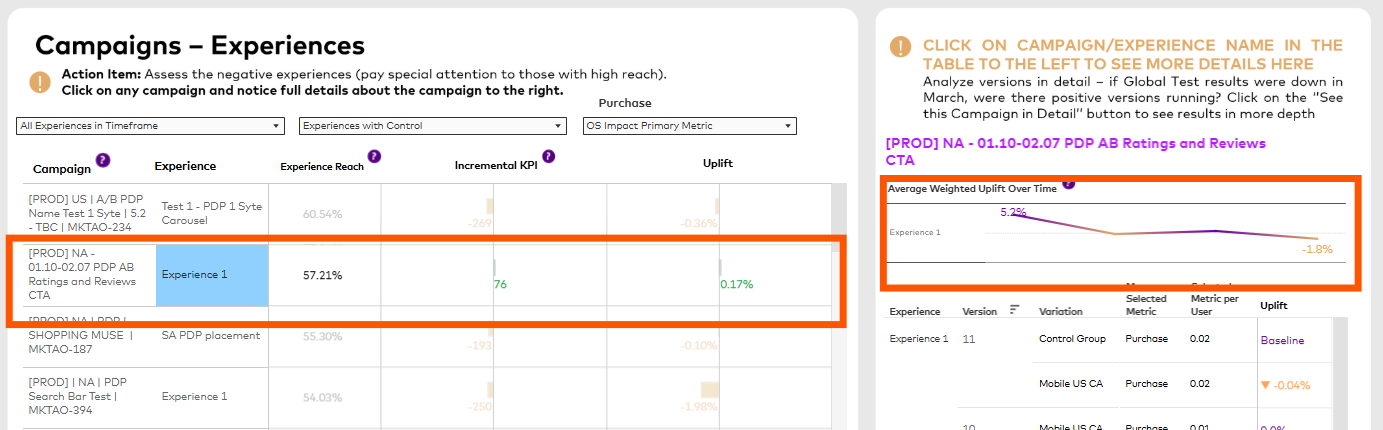
1. Dig deeper by clicking on the experience or campaign name.

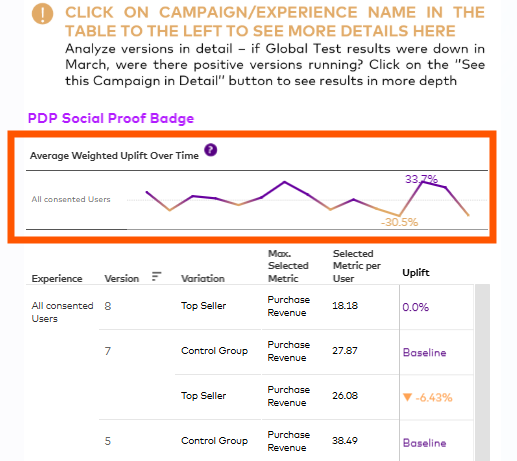
template

Now on the right side check the performance graph over time:

template

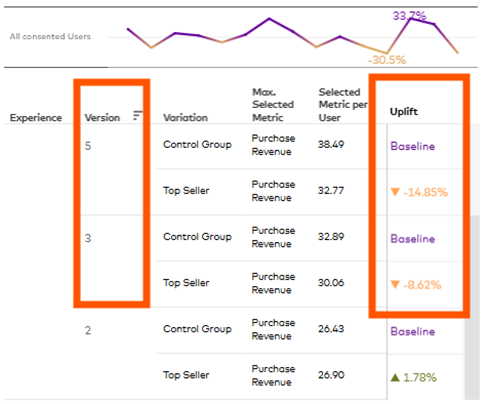
And overall experience version history:

template

Now it’s time to ask yourself:

  • When did the performance start to drop?  What else was going on at that time?
  • What changes were made in those versions? Did any of them hurt performance?
  • How long was the campaign running before the change? A quick drop early on might mean setup issues. A slow drop could mean users got tired of it.
  • Did anything outside the campaign affect results? Think about seasonal changes, product launches, or sales. Consider overlapping campaigns on same pages wherein the combination of experiences yields a net negative outcome
  • How does this campaign’s timeline compare to others? Is it showing a trend or is it the only one?

2. Conversely, if there was a version that turned the performance trend from negative to positive, ask yourself: what was changed here? Could this approach be applied to other experiences?

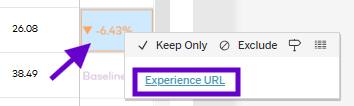
3. Gather more context by going to the Admin tab — the link will appear when you click on the uplift:

template

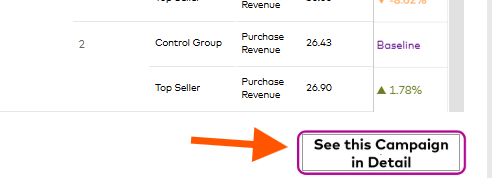
And by going to the “See This Campaign in Details” tab, you can check the start and end dates, traffic data, and more.

template
Note: This tab is still “work in progress”. Be sure to double-check with the admin to confirm the insights you gather here.

Investigating positive-performing campaigns

Focus on experiences with high reach compared to other campaigns, where the incremental KPI and uplift are positive but close to zero. These are the experiences that have a relatively large audience reach but don’t seem to be fully leveraging it.

Ask yourself the following questions:

1. What has been happening with this experience over time? Could it have performed much better in the past?

template

2. Is there potential to generate more value from this audience? It might be the right time to experiment!

Contact sales

Talk to an expert to learn how Mastercard can enhance your business through our products and services.

Mastercard