Lesson

Choosing the right optimization KPI for your A/B tests

By addressing some common A/B testing pitfalls and introducing more reliable approaches to measuring the efficacy of your experiences, you can be sure to optimize for success.

Gidi Vigo profile photo

Gidi Vigo

Vice President of Product,

Dynamic Yield,

Mastercard

For marketers looking to improve their site’s user experience, A/B testing is one pillar of experience optimization used to help increase conversion rates. Relied on as a way to experiment with large and small changes before going “all in,” it is an important tool for deciding what experiences get applied to all users. 

Therefore, not analyzing the results properly could mean the difference between potentially massive uplifts and diminishing returns. 

By addressing common A/B testing pitfalls and introducing more reliable approaches to measuring the efficacy of your experiences, you can be sure to leave here knowing how to optimize for success. 

Look at conversions instead of unique conversions

Marketers have gotten very used to setting conversion rate as a main KPI, but when it comes to testing, it simply does not tell the whole story. While conversion rate means the number of unique users that converted, your business goals should be set up for more conversions, not necessarily more convertors.

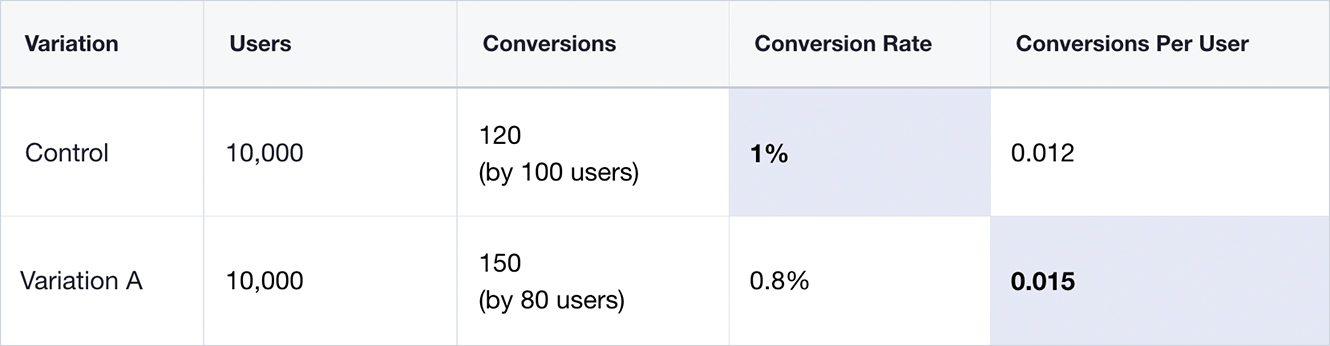
Look at the table below and ask yourself, which variation performs better?

Conversions table 1

It is safe to say that Variation A performed better, resulting in more conversions and an uplift of 25%. So, even though it might be easier to think about percentages than small fractions, is it worth losing out on the meaningful data insights? 

Don’t opt for the less optimized path. 

To conclude: If your objective is an action that can only be done once, like registering to a site or becoming a newsletter subscriber, conversion rate and conversions per user should show the same result (one with percentages and the other with fractions). However, if the objective is to add an item to a cart or purchase, Conversion Rate is an inferior metric, as it assumes you’re looking for convertors and not conversions — and multiple conversions by a user do not weigh more than a single conversion. 

Average by users, not sessions 

Analytics tools taught us to analyze site engagement through the prism of sessions. For instance, an e-commerce brand measuring revenue would look to RPV (revenue per session), and a media site, average number of pageviews per session. 

However, if you’re choosing the variation once for each user, you should average results by number of users. Averaging by sessions will many times result in a bias in favor of the worst variation. 

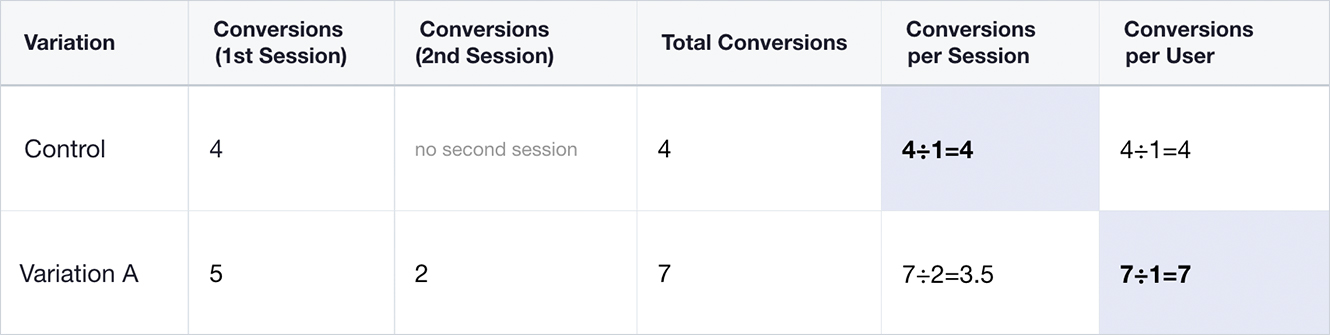
As an example, here is the result of a test where the primary metric is clicking the Add to Cart button. After two users entered the test, one was served with the control and converted four times, not returning to the site. The other was served with variation A and converted five times, returning for another session, in which he converted twice. 

Conversion table 2

When dividing conversions by sessions, the control won, with four conversions per session against variation A’s 3.5. Though, conversions per user paints a different story, with variation A winning against the control 7 – 4.

Would it make sense to punish variation A, which ultimately produced more conversions because it led to an additional session that had a small number of conversions?

To conclude: If you’re comparing two alternatives, averaging results by users —  not sessions — will allow you to optimize for a better user experience on your site.


Choose the right primary metric

When performing a test, you usually have one metric in mind that is the primary — the winning variation will be determined by the success of each variation for this metric. This can include any event, such as clicking a specific button, adding items to the cart, completing a purchase, etc.

A marketer for an e-commerce site once asked:

“Why do you allow so many metrics to choose from? I only need one: Revenue.”

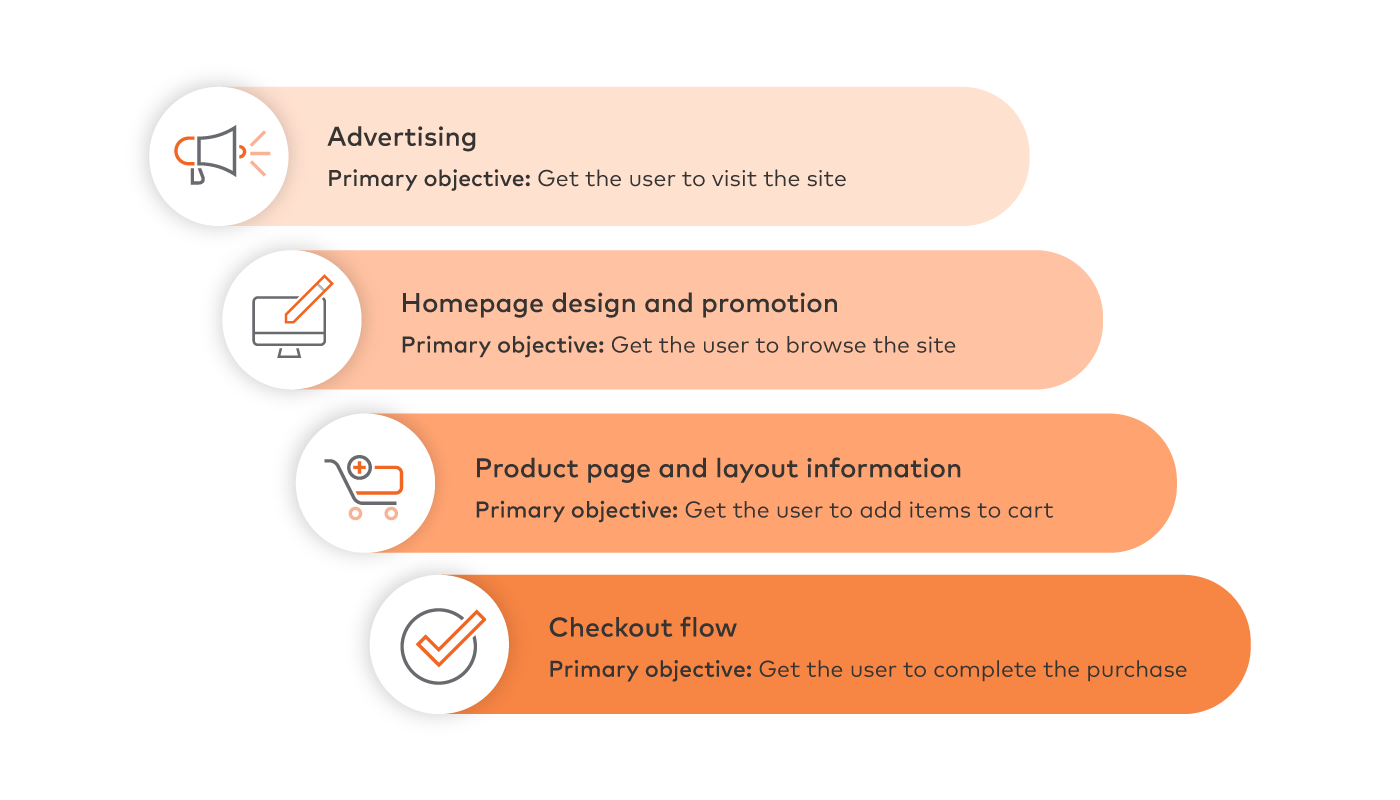
As with any business relying on revenue, it makes sense as an approach that everything contributing to this goal would be good, and everything negatively impacting it, bad. However, conversion funnel methodology contradicts this model for thinking as each step of the funnel is aimed towards advancing the user to the next step in the funnel, meaning results should be optimized accordingly. 

Here’s a simplified version of an e-commerce site conversion funnel.

Variation distributions after 1999 trials graph

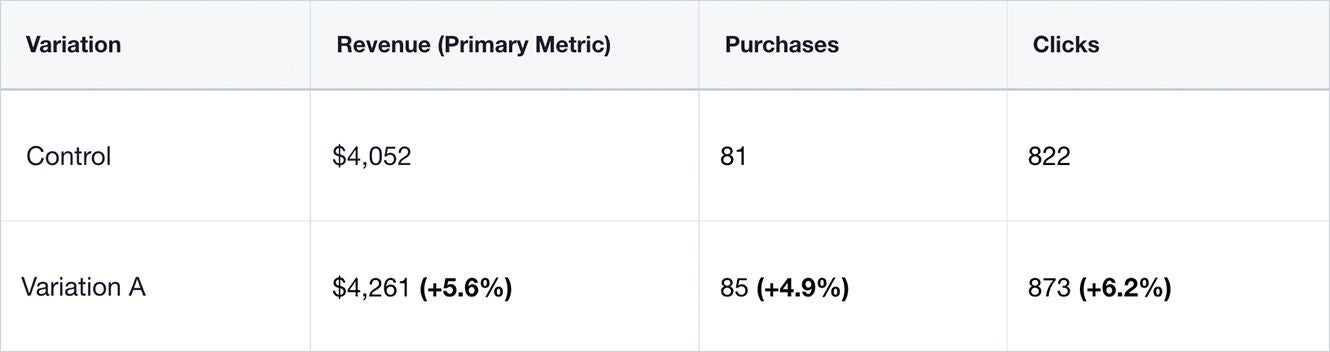
After analyzing tests run earlier in the conversion funnel on a new homepage navigation element of an e-commerce site, after seven days, this became quite obvious. 

Conversion table 3

There is no clear winner yet for the primary metric, as the number of purchases was too small. Though, when looking at clicks, enough data insights were collected to determine variation A as a winner. And so, we see the mathematical reason to select a closer, less delayed conversion. 

Furthermore, selecting a conversion farther down the funnel will cause significant results to arrive a lot later because many of the users that advanced in the funnel will now experience the same site. It is not unlikely the rest of the experience and conversion rate will be the same. 

Hence, the difference between their performance will be small. 

This is what we refer to as Immediate Reward and Delayed Reward. 

  • Clicks on a variation is immediate 

  • Purchases on a test in the checkout page are immediate reward 

  • Purchases on a test in the homepage are delayed reward 

To conclude: E-commerce conversion rate optimization allows marketers to more quickly improve conversion rates. By setting objectives that are achieved more immediately, results are easier to track, and key metrics easier to improve. 

Contact sales

Talk to an expert to learn how Mastercard can enhance your business through our products and services.

Mastercard